Flowsense: Company
Health Management App
PROJECT TYPE
Interaction Design
TIMELINE
4 months
DESIGN TEAM
Anushree Joshi
Chinmay Hulyulkar (Design Lead)
ABOUT PRODUCT
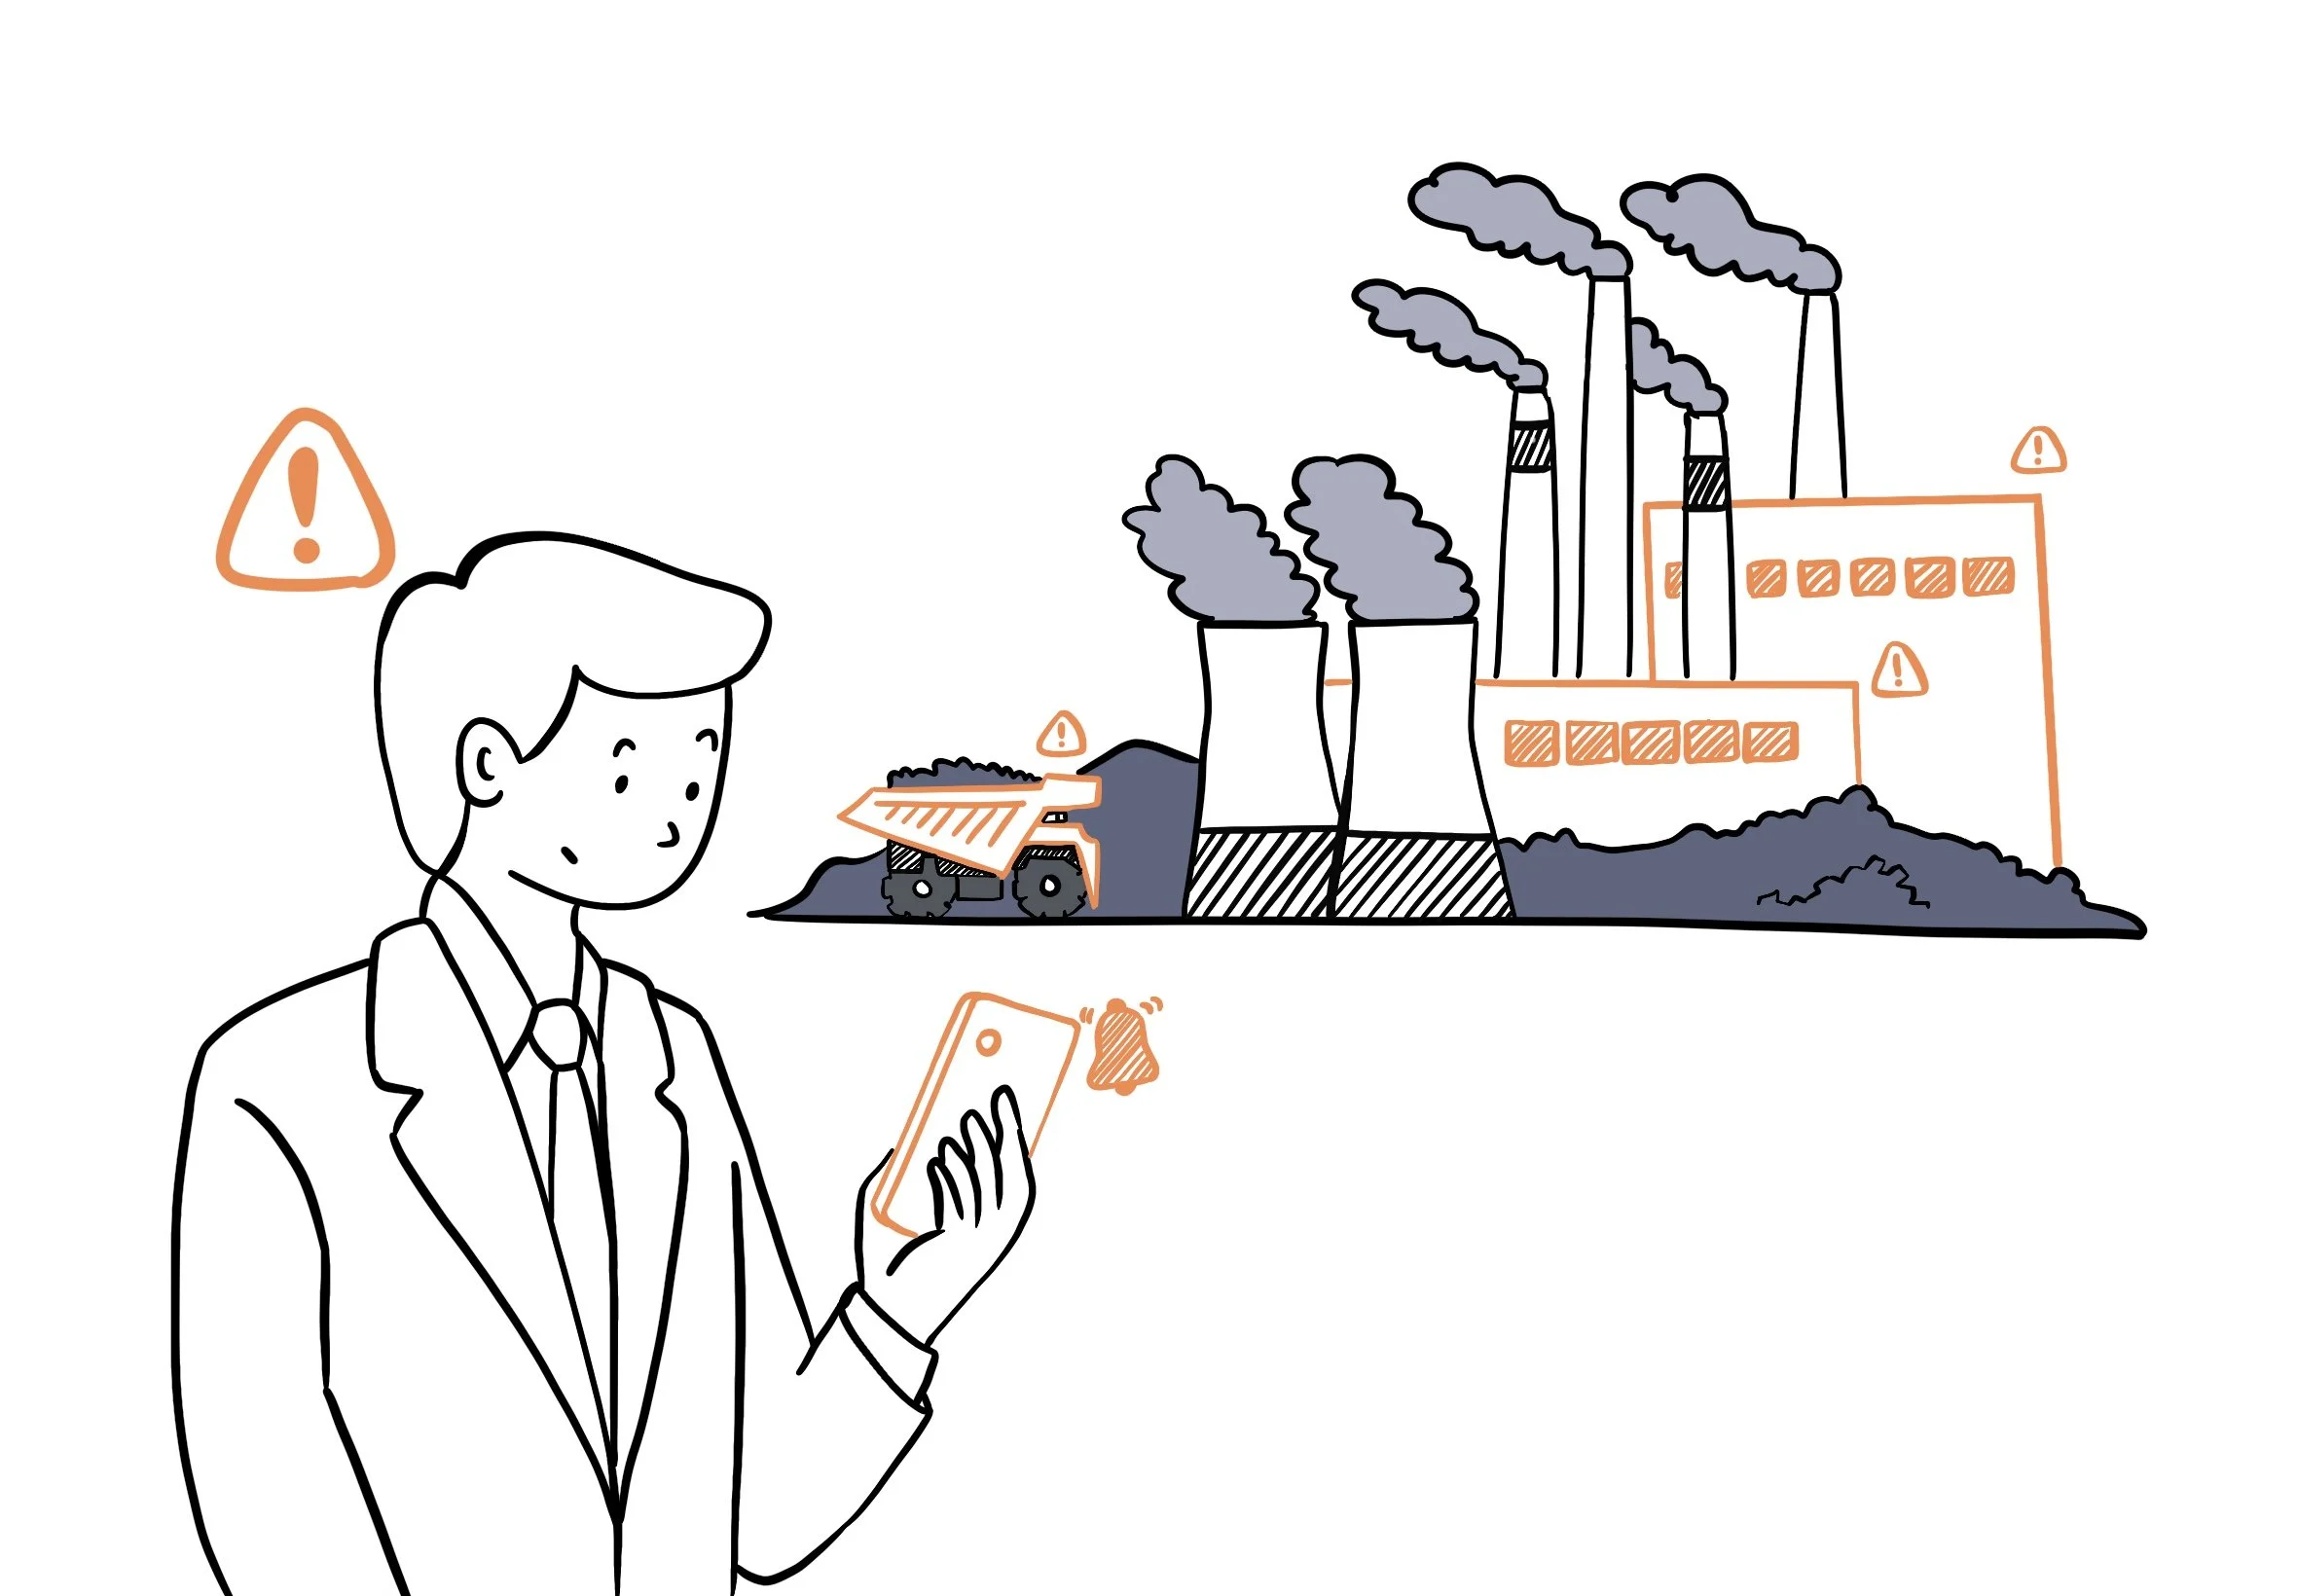
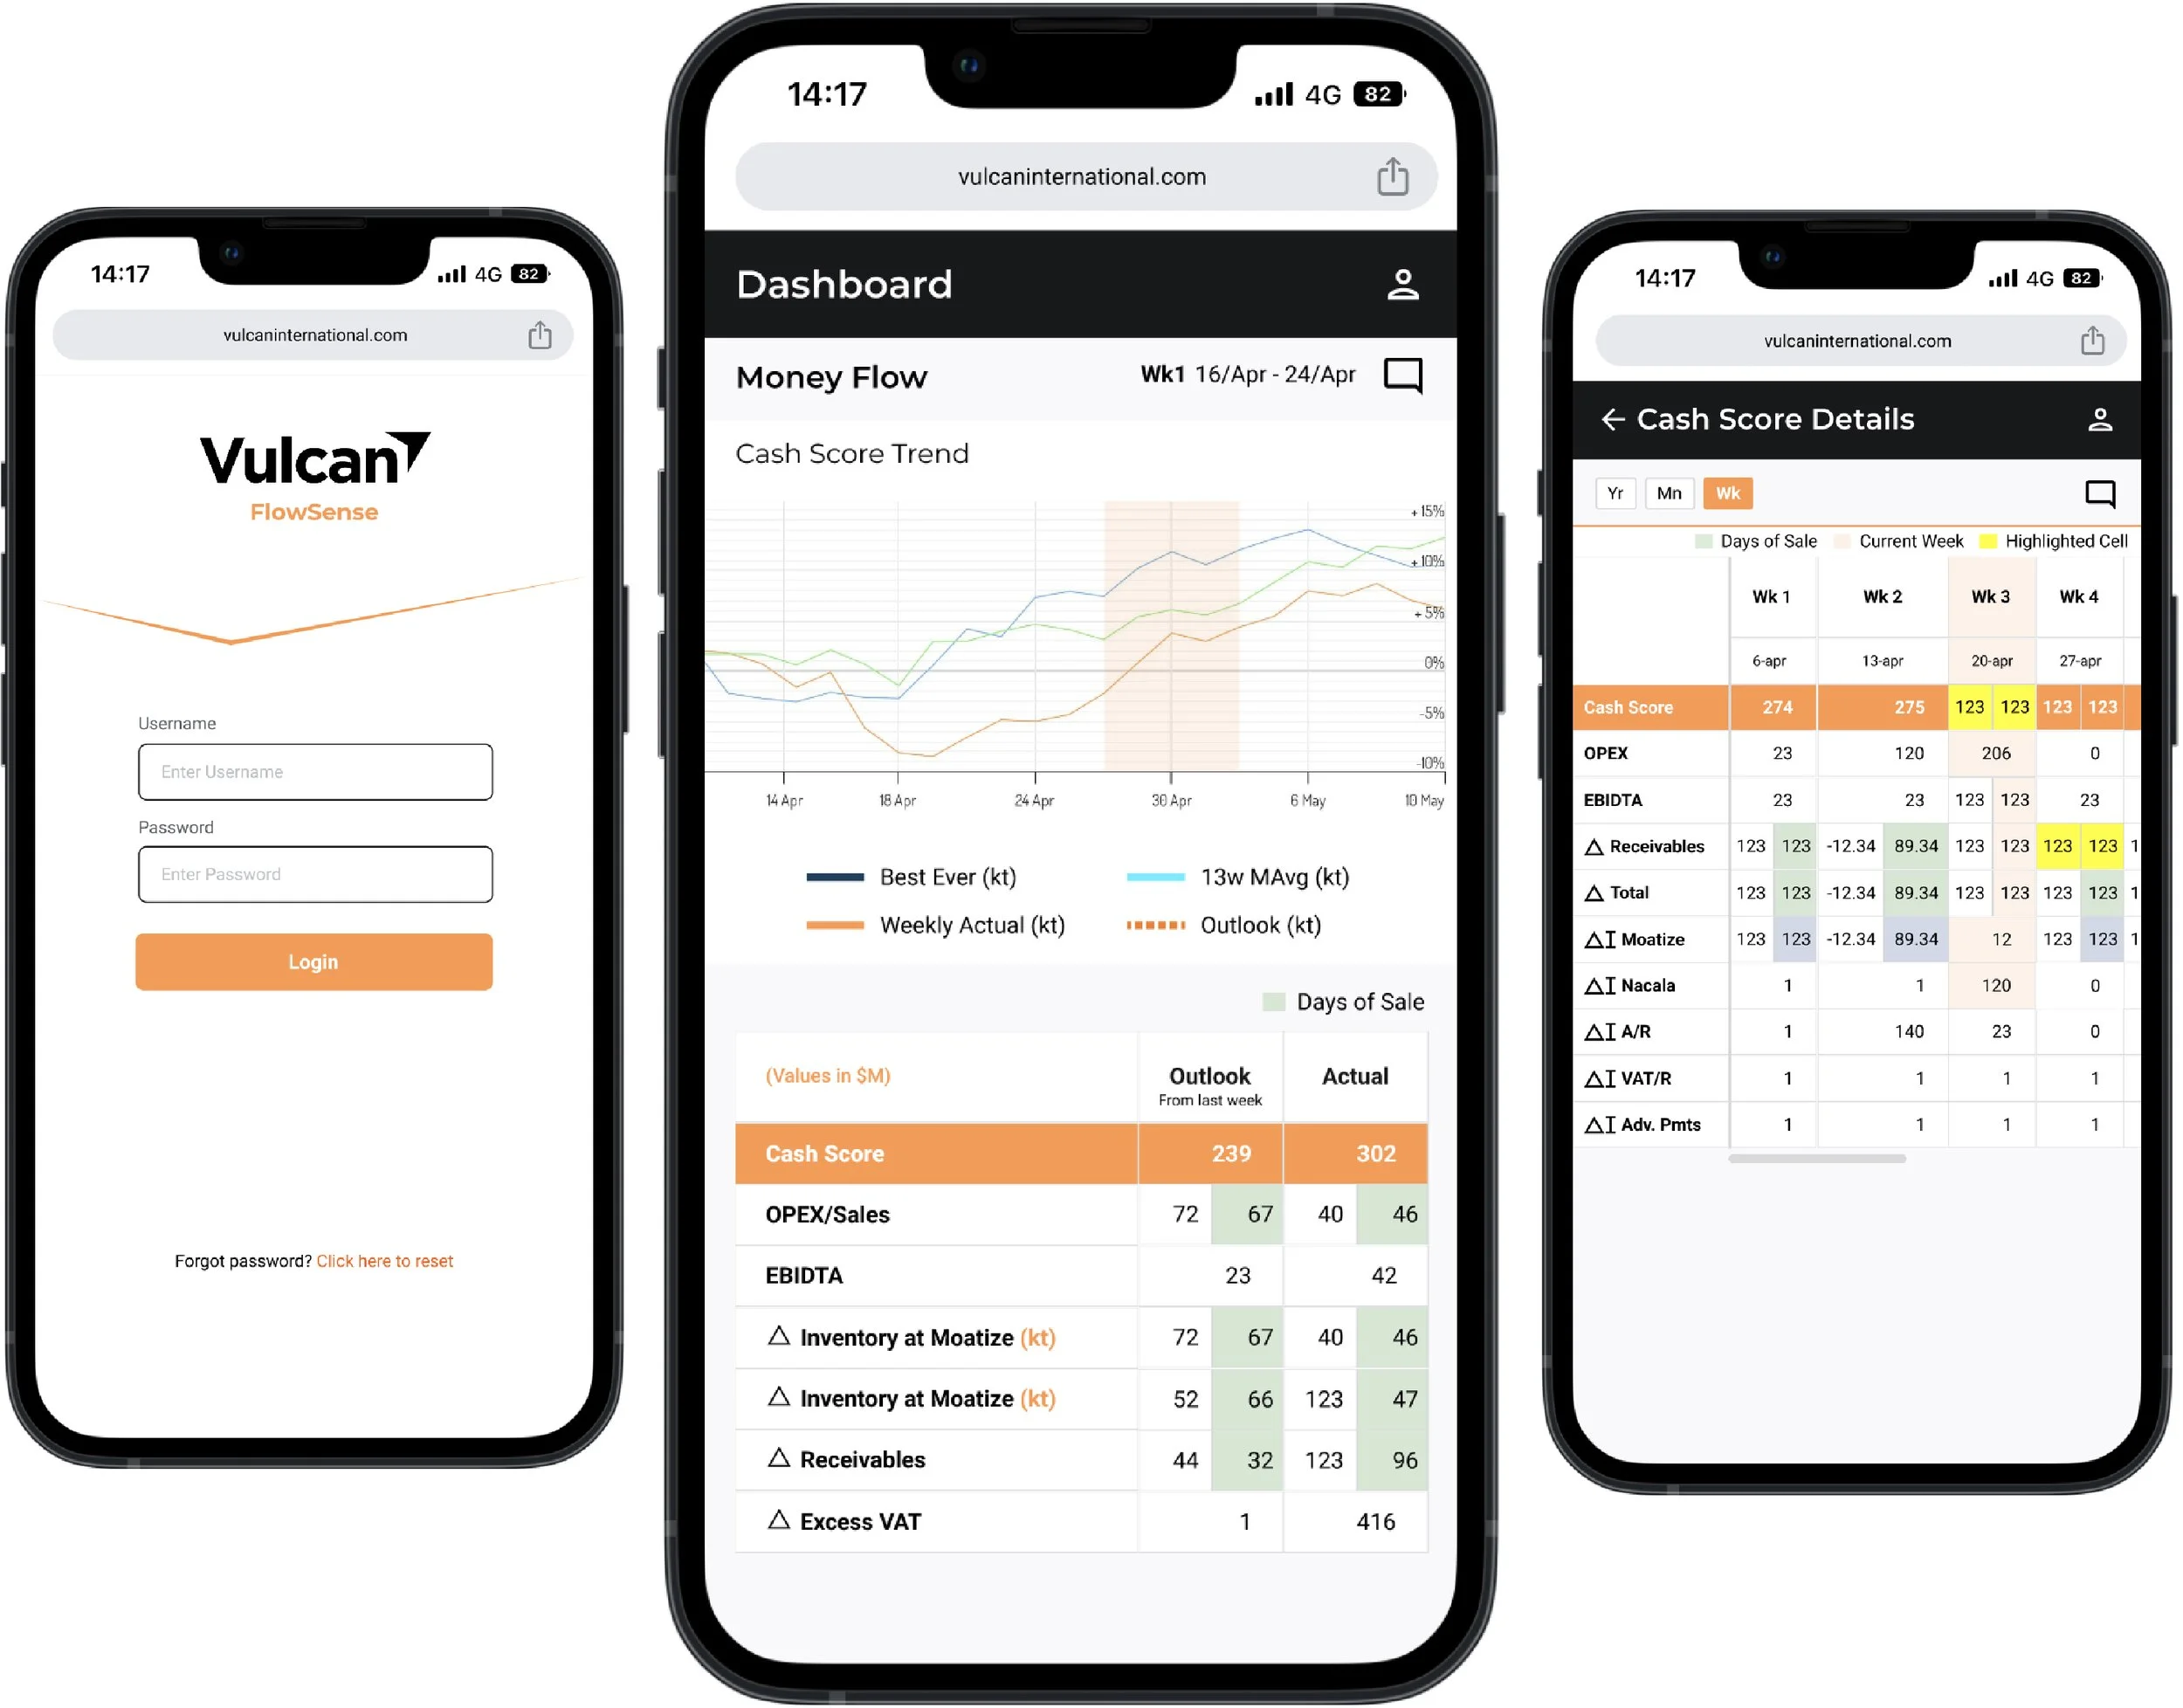
Flowsense is an application designed for a coal mining company executives to assit them in tracking cash flow and production flow - thereby reviewing health of the opreations at the coal plant.
KEY HIGHLIGHTS
Led a co-creation workshop and client meetings to map the overall coal-plant ecosystem and translated research into key insights and later into design brief and project scope.
Worked on information architecture, wireframes and low-fidelity mockups and concepts.
Created design system using Talentica Software's FLEX Design System and created high-fidelity prototype and
Oversaw the design handoff and collaborated with developers to ensure successful implementation and MVP delivery
PROJECT BRIEF
Design an application that helps executives read and track the data of cash flow and production flow while indicating whether it is positive or negative (relative)—on the go.
DISCOVERY PHASE
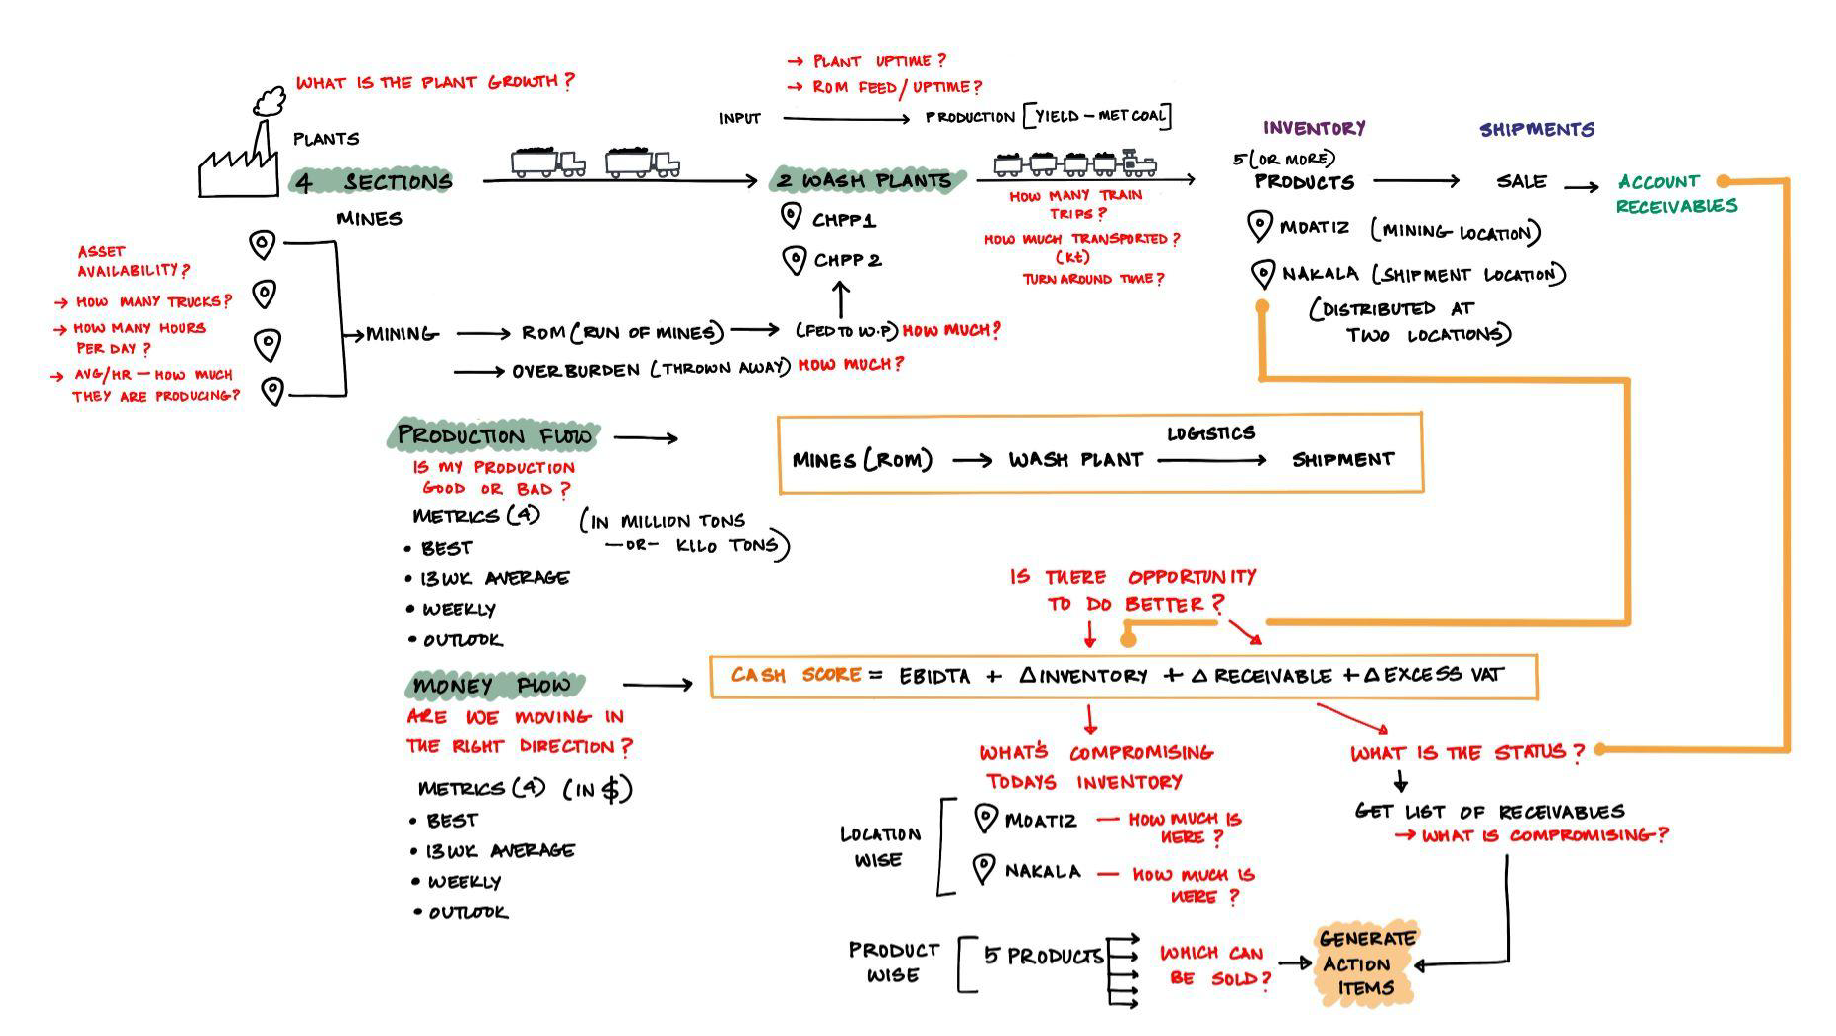
Understanding Mining Ecosystem
During the discovery phase, we conducted a co-creation workshop
and mapped out the ecosystem along with the client.
Key takeaways from co-creation workshop:
Fundamentals of the coal mining operations
The stakeholders and the client expectations
The objective of the application is to help executives,
Identify the factors compromising productivity
Identify opportunities for increasing efficiency
IDEATION PHASE
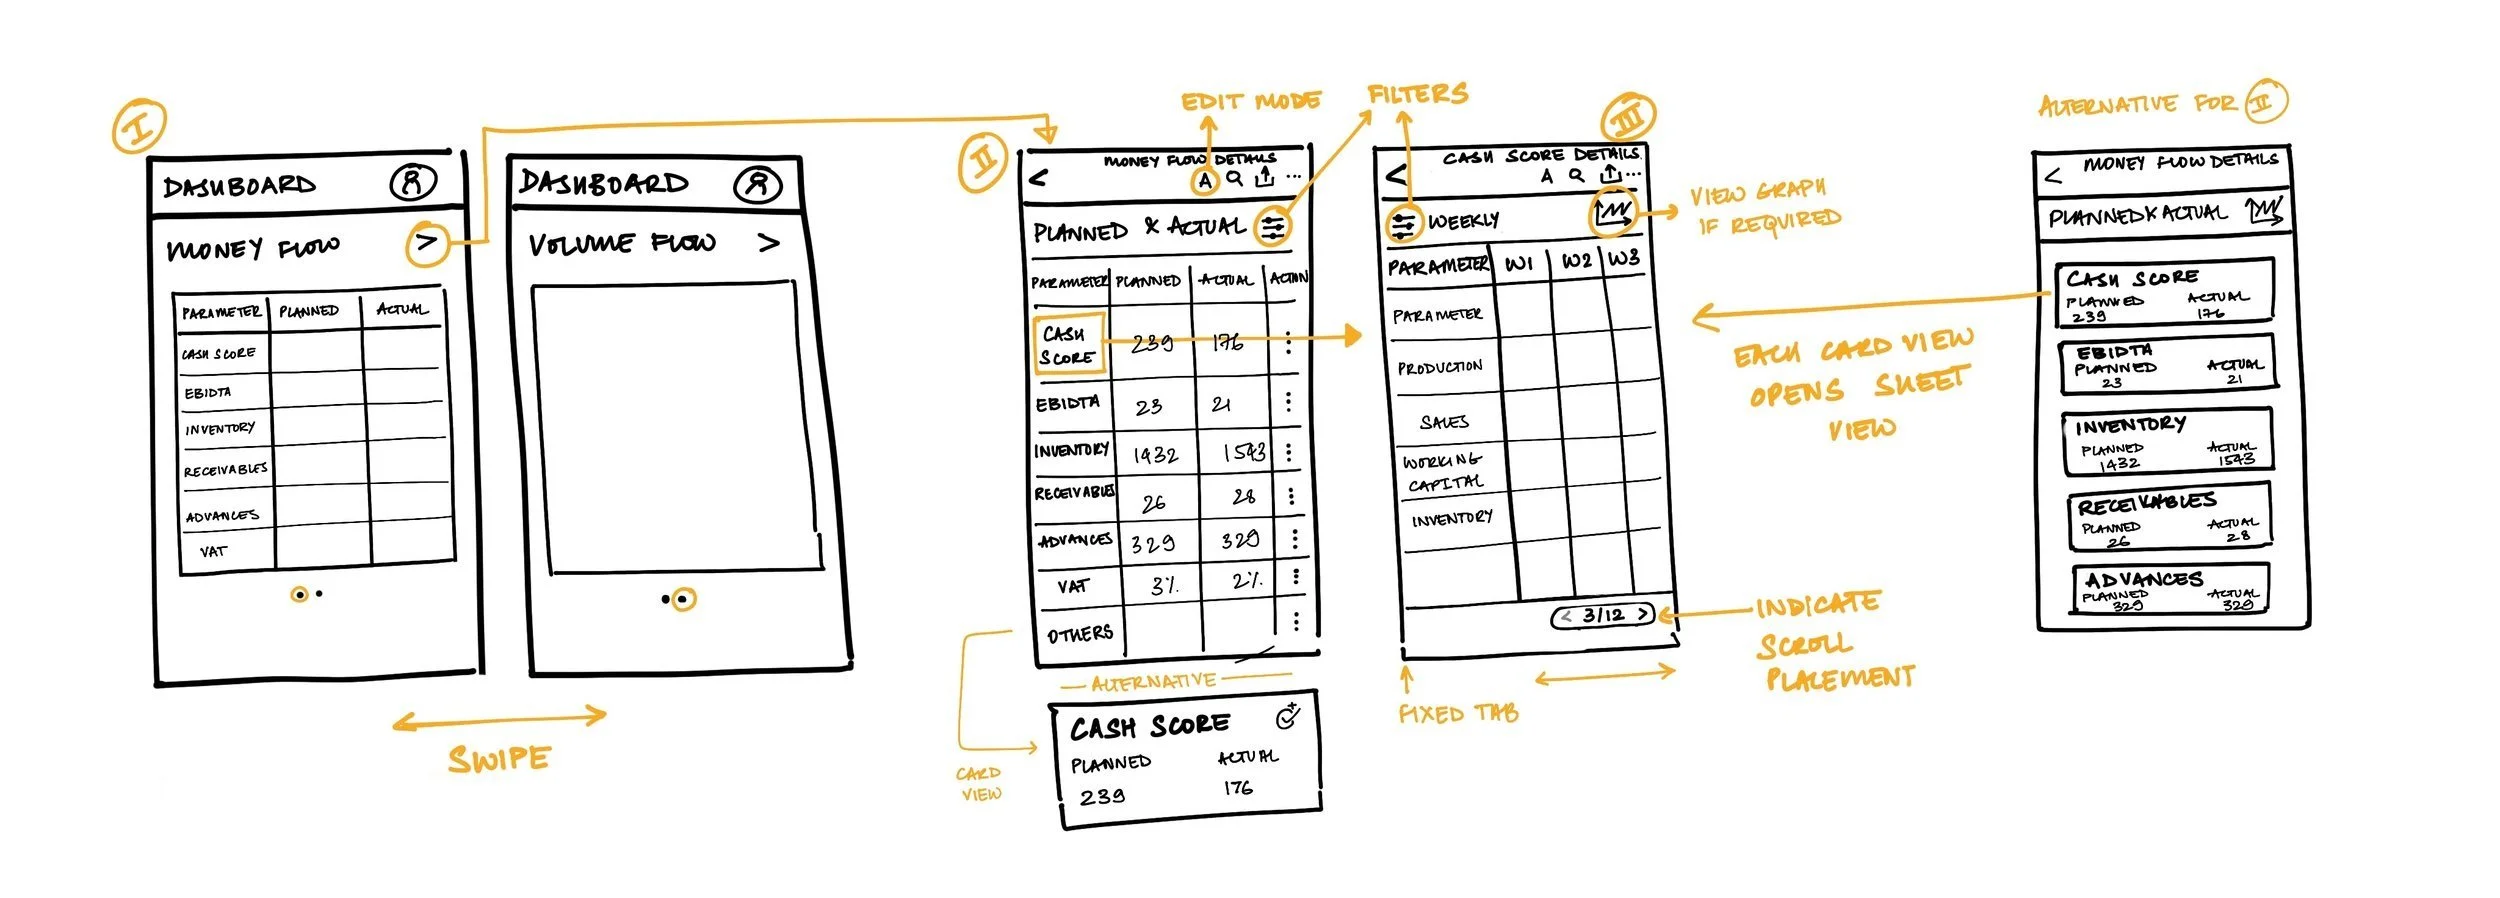
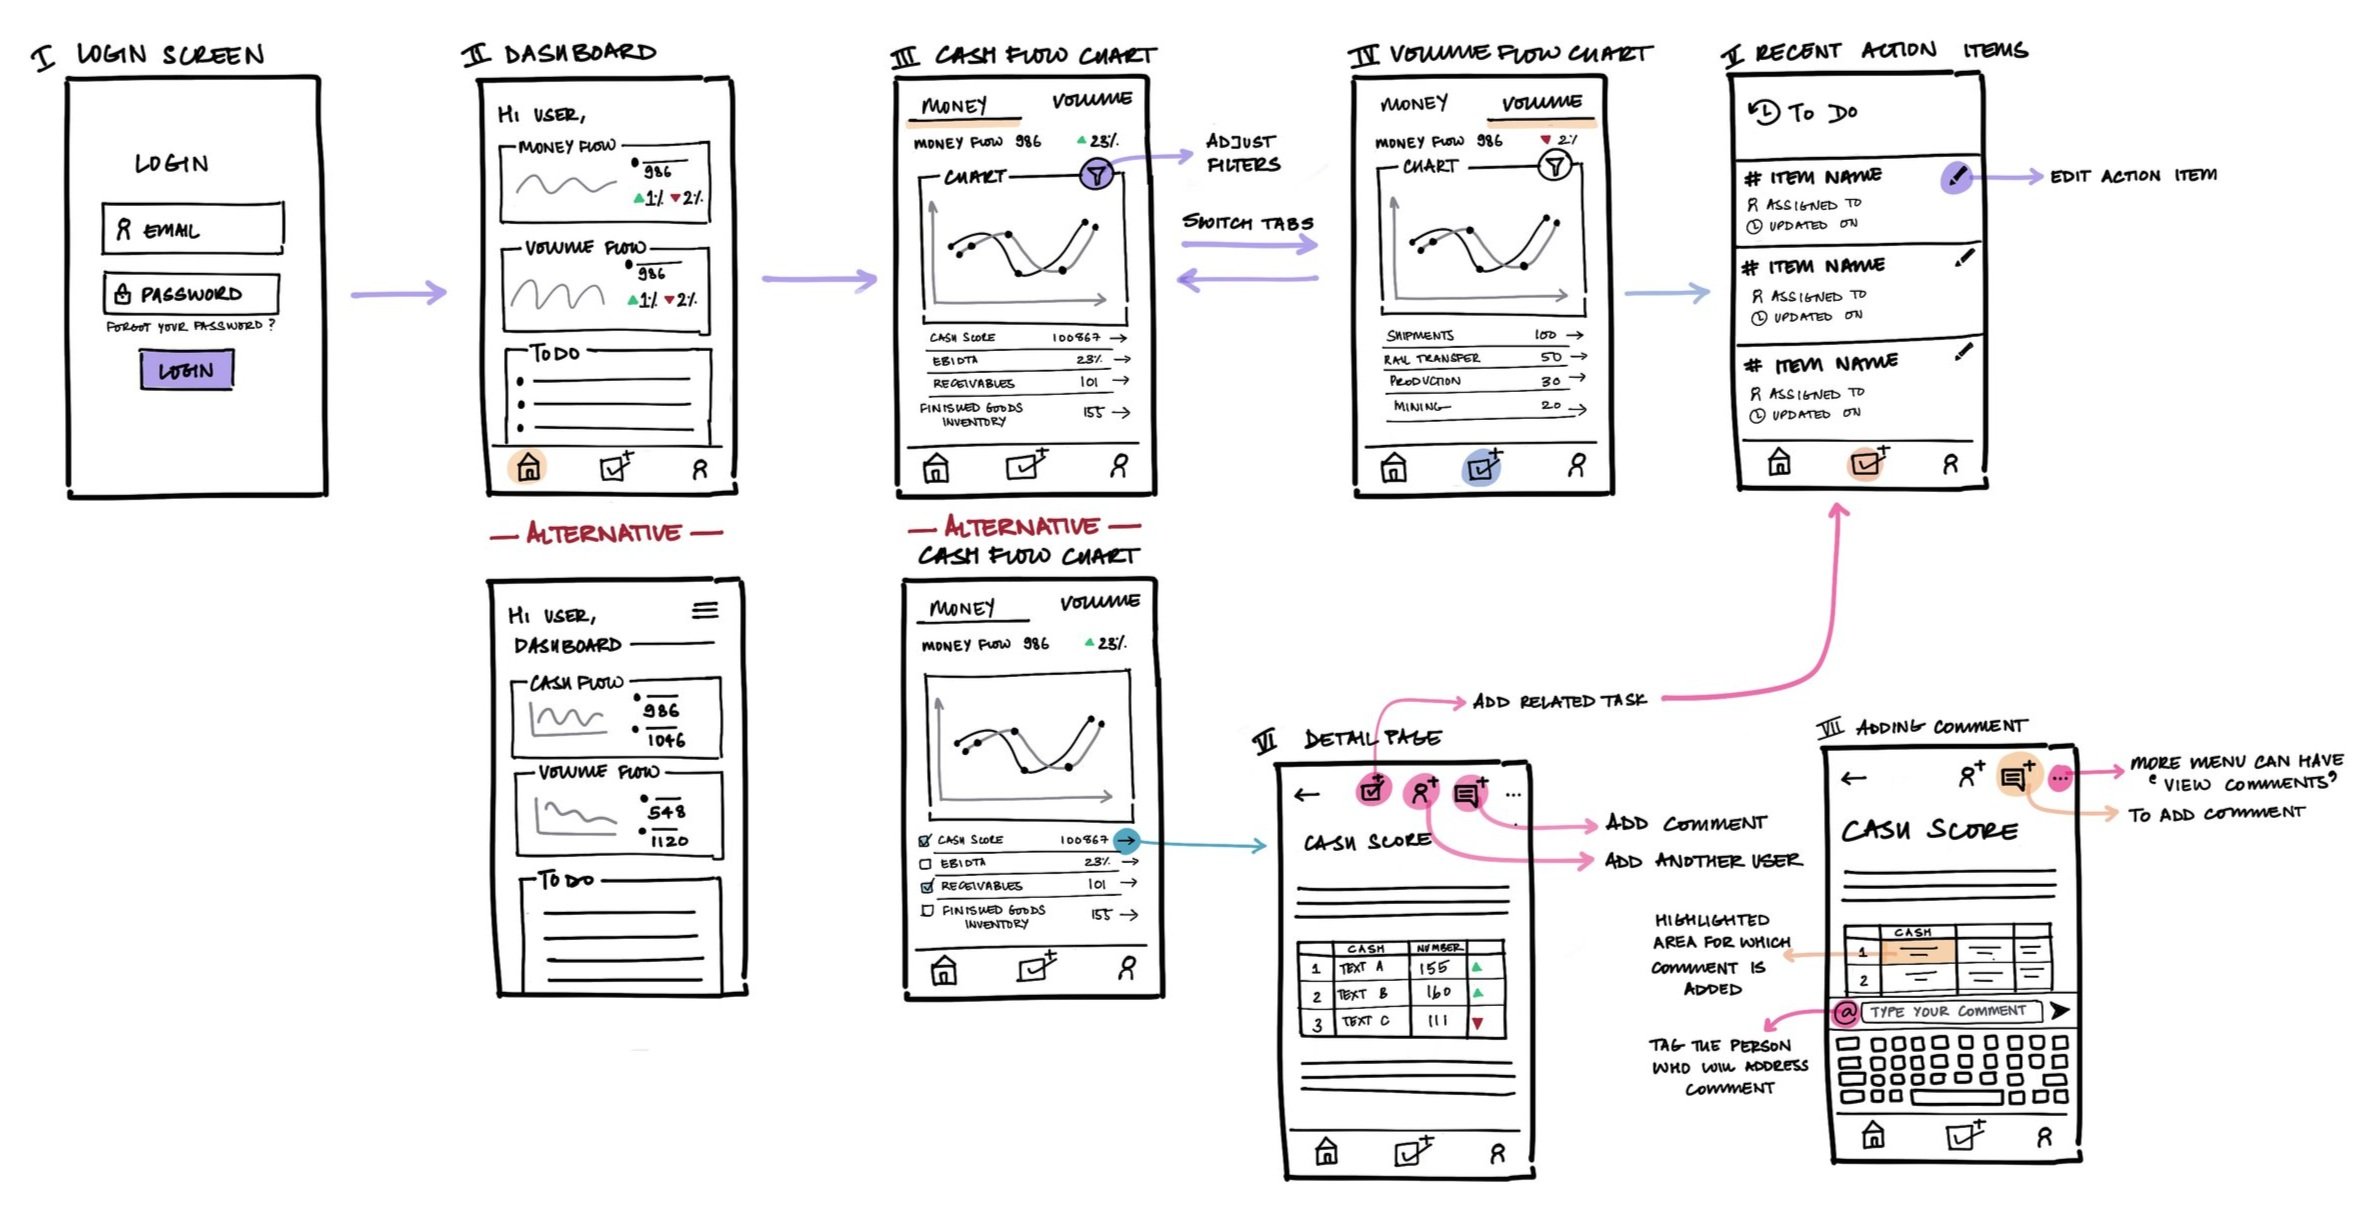
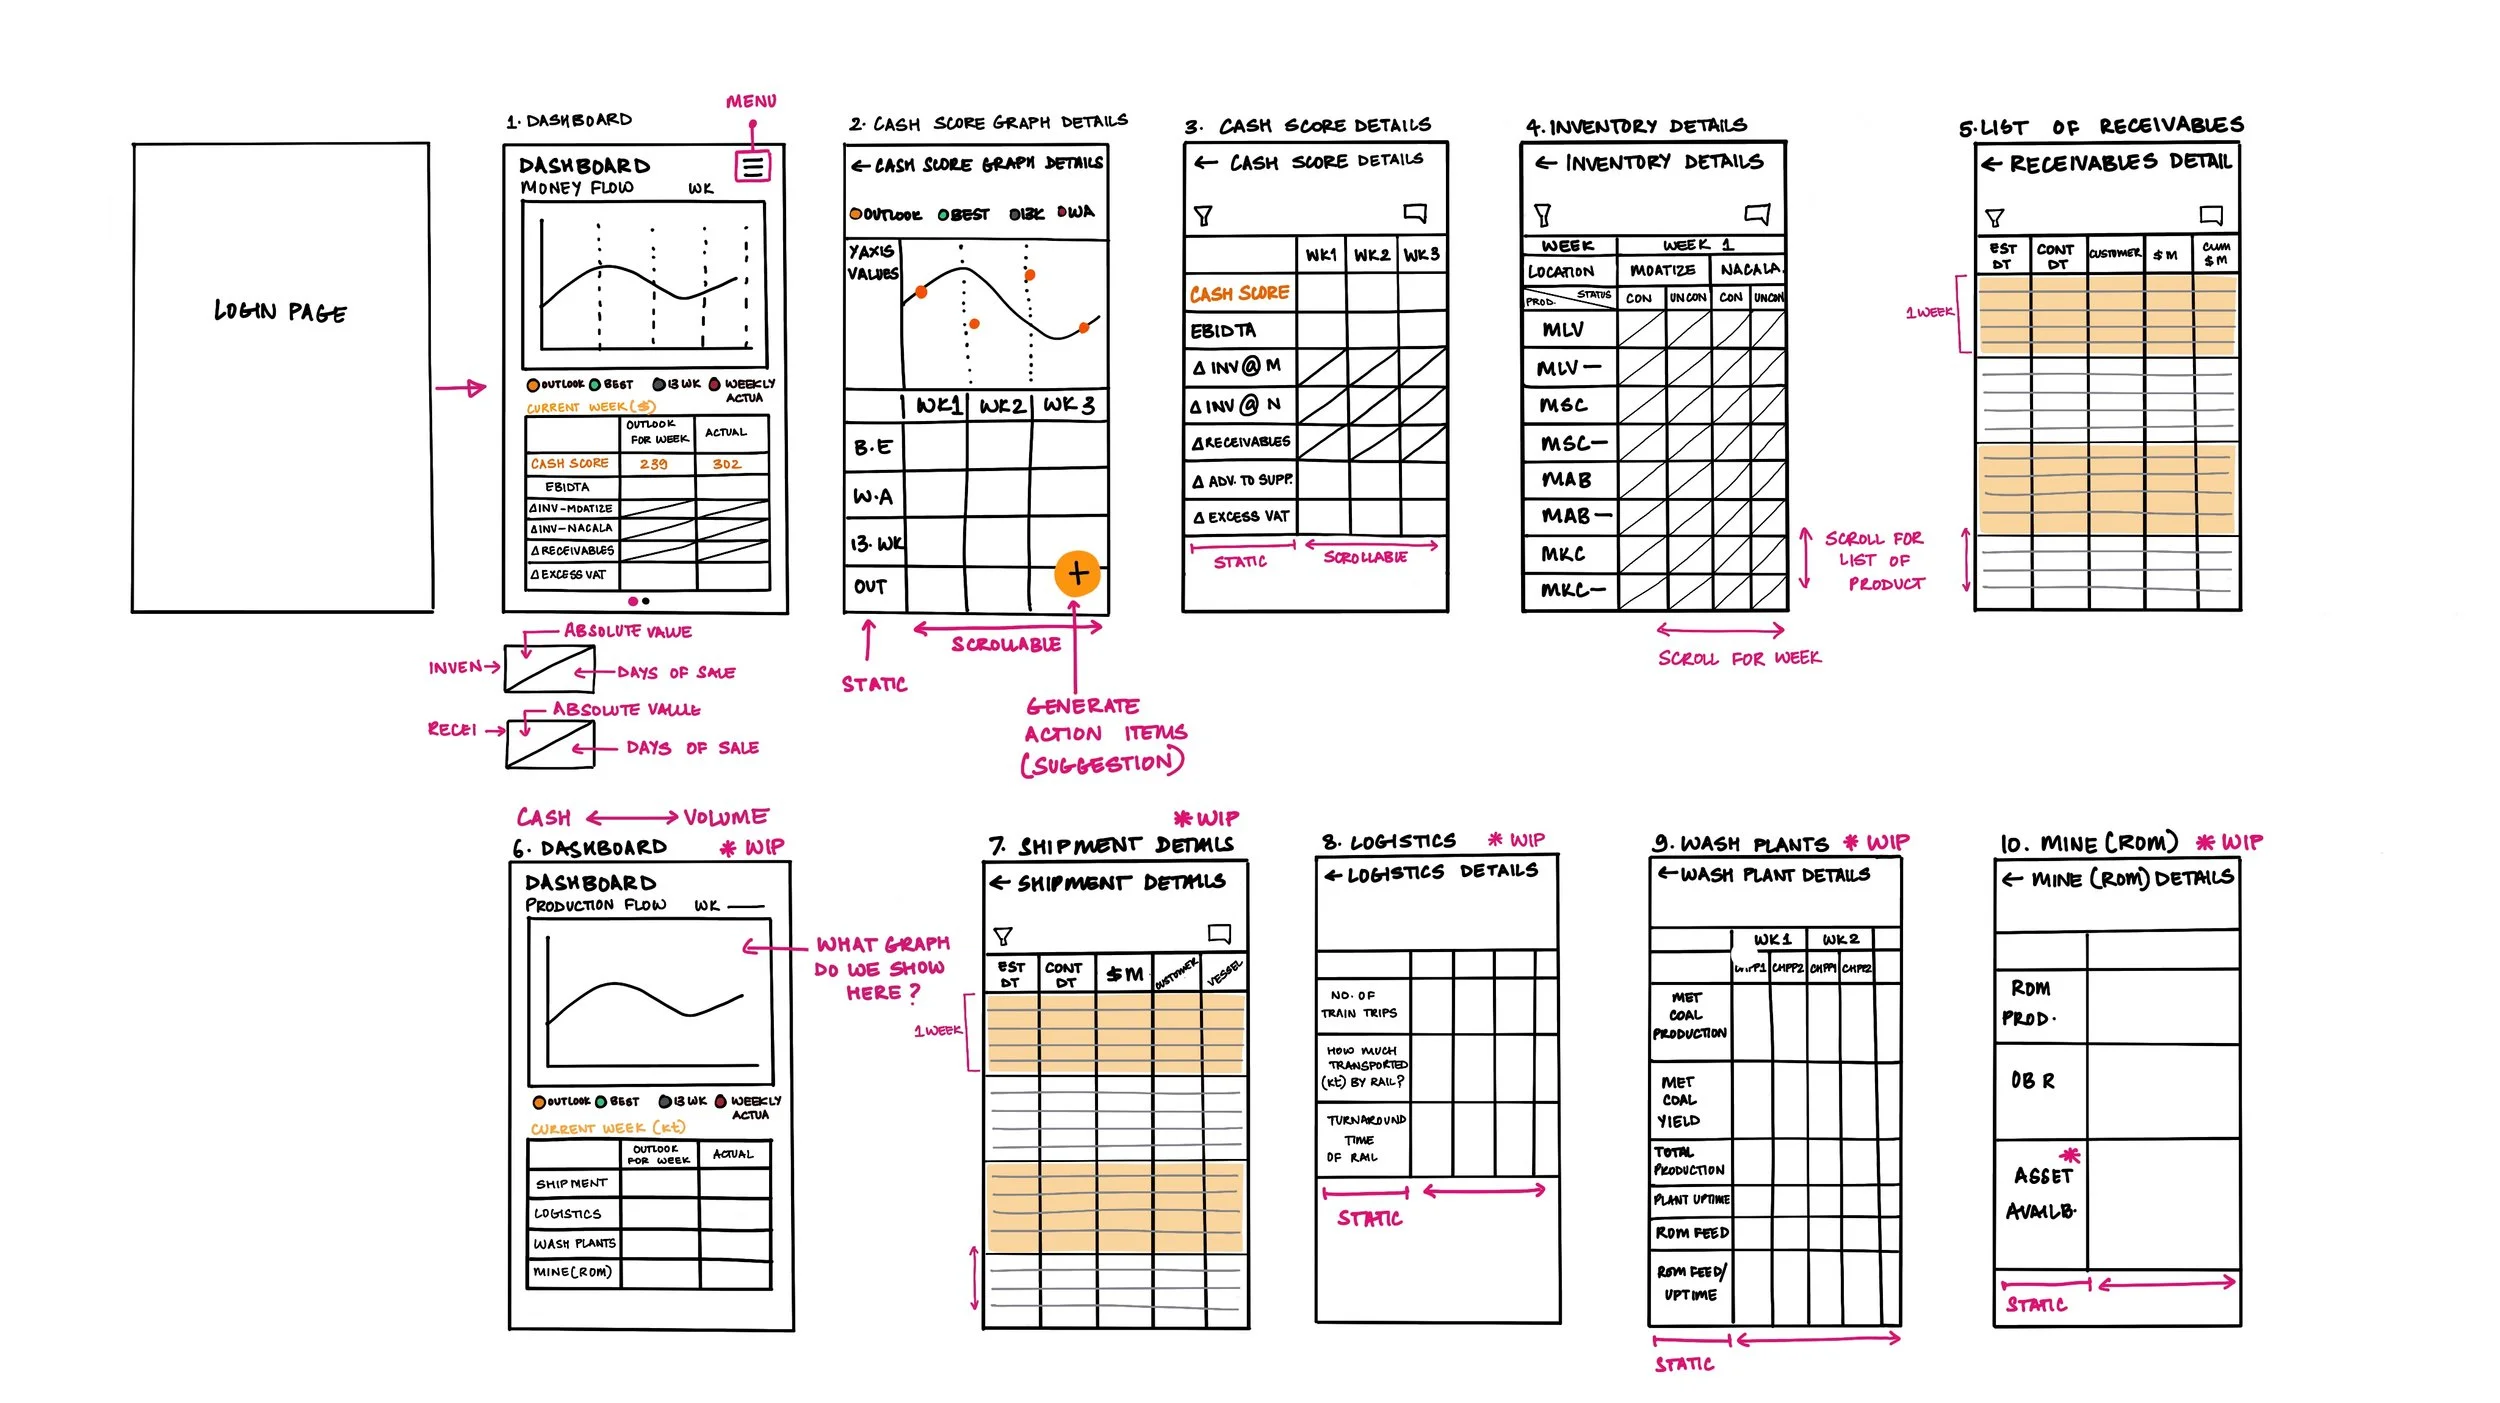
During the ideation phase we used quick sketches to discuss and brainstorm the workflow with our client. These sketches served as building blocks to explore, add and prioritise features. We refined them further as a blueprint to statr with low-fidelity wireframes.